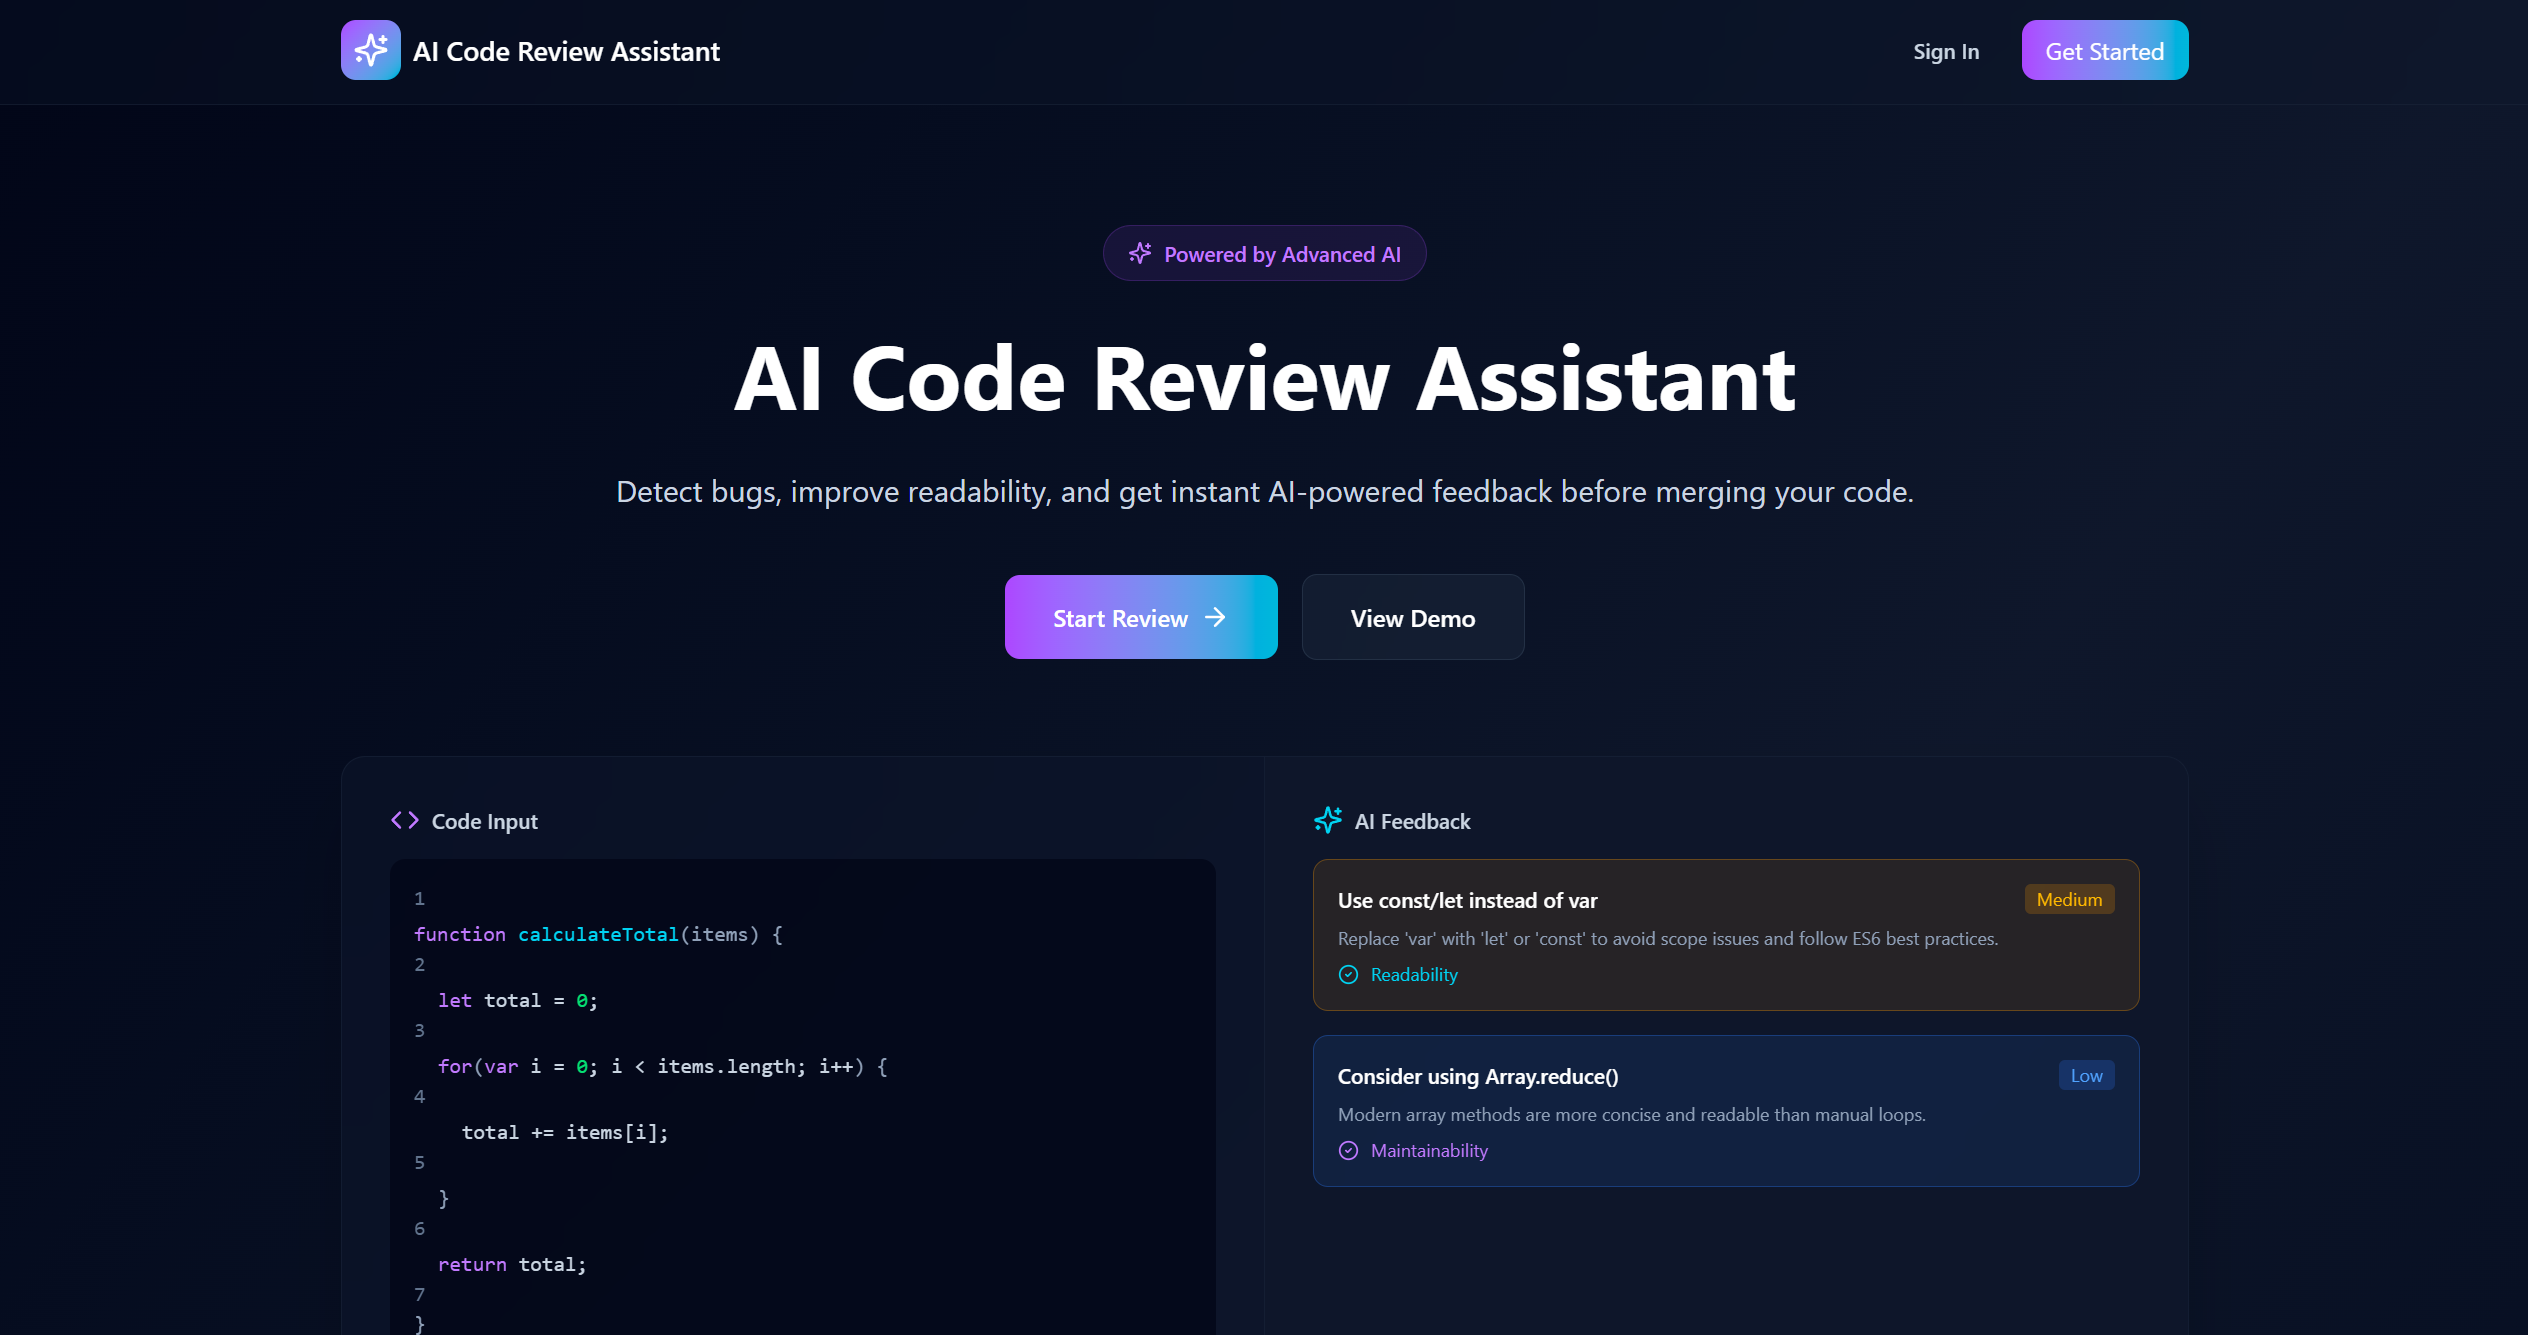
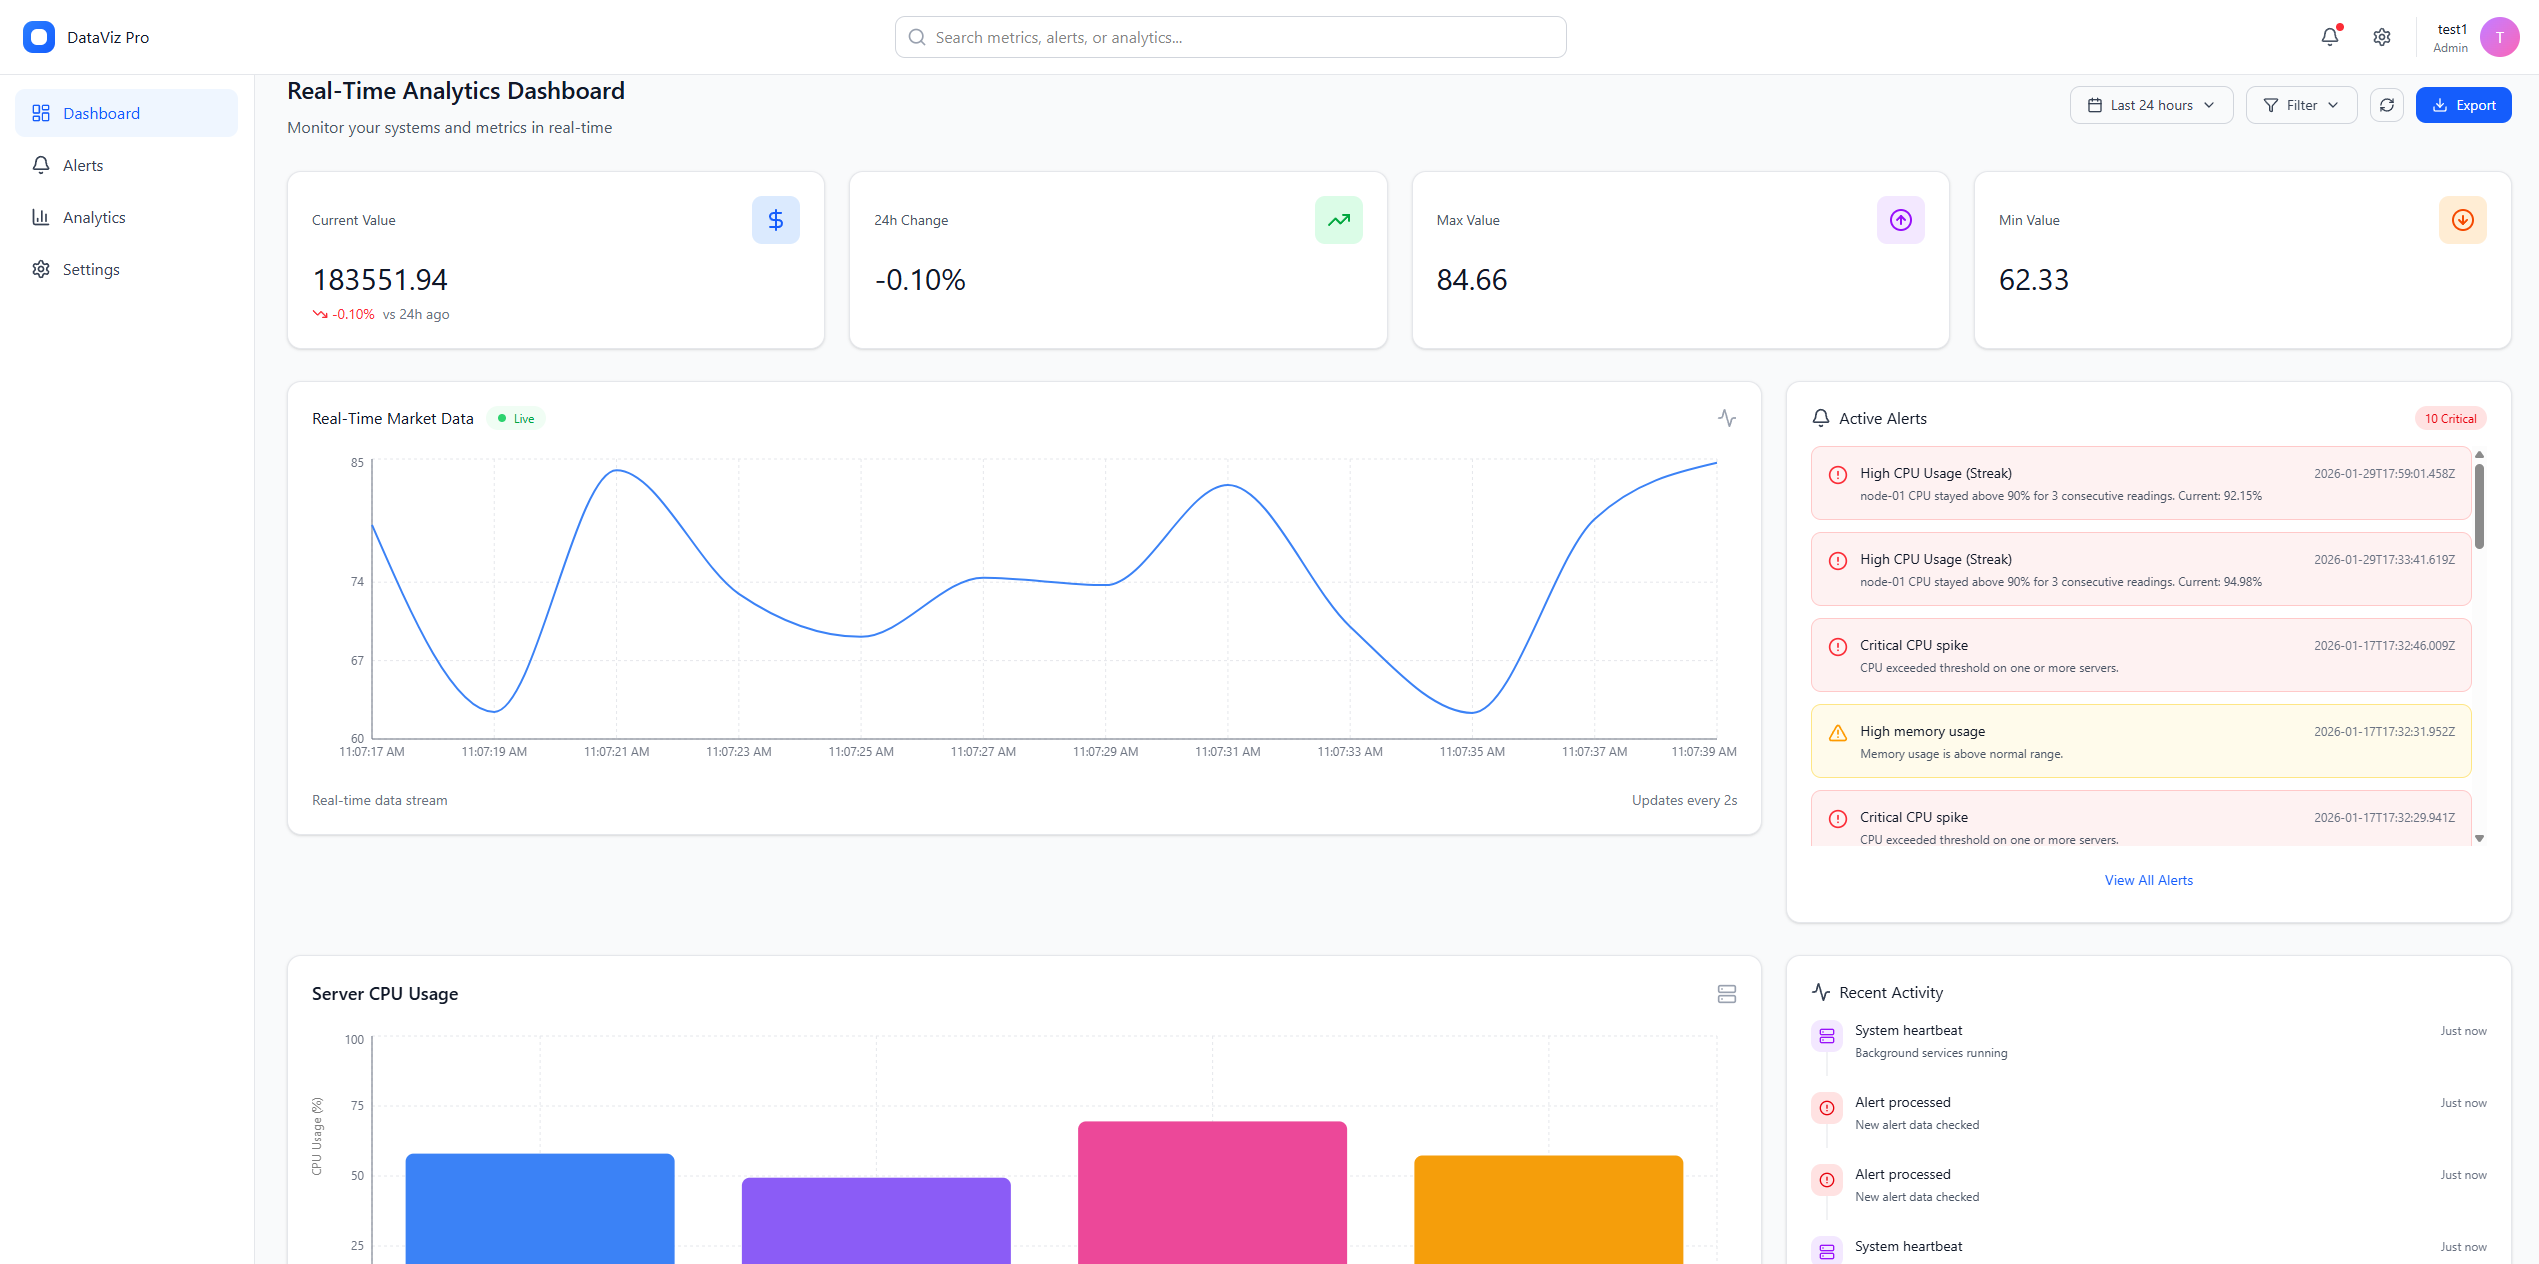
A full-stack monitoring dashboard that displays continuously changing data through WebSockets, interactive charts, authentication and real-time alerts.
- WebSockets
- Real-time communication
- Full Stack
- Application type
- Recharts
- Data visualization
- Team
- Development model
Real-Time Data Visualization Dashboard is a full-stack monitoring application built to display live operational data through interactive charts and KPI cards.
The frontend receives updates from the backend through Socket.IO, allowing users to see data changes without refreshing the page.
The project was developed collaboratively. My primary contribution focused on the frontend interface and real-time data presentation, while backend responsibilities were shared within the team.
My contribution
Frontend and real-time experience
- Building the dashboard user interface
- Creating interactive chart components
- Connecting frontend components to Socket.IO events
- Displaying real-time KPI updates
- Implementing connection status indicators
- Creating alert and notification interfaces
- Supporting integration with the backend team
01 · The problem
Traditional dashboards can display outdated information
- Manual refreshes interrupt monitoring workflows
- Changing metrics can be difficult to notice
- Large datasets need clear visual organization
- Users need immediate alerts for important events
- Connection failures must be visible to the user
02 · The solution
A WebSocket-powered interface with live visual feedback
- Continuous updates through Socket.IO
- Interactive Recharts visualizations
- Live KPI cards and metric changes
- Real-time alert notifications
- Visible server connection status
Live Data Updates
Dashboard values update automatically through an active WebSocket connection.
Interactive Charts
Recharts components display trends and changing values through visual graphs.
KPI Cards
Important metrics are summarized through readable dashboard cards.
Real-Time Alerts
Important system events can be surfaced immediately through alert components.
Authentication Flow
Protected dashboard access is supported through an authentication workflow.
Connection Status
Users can see whether the client is connected to the real-time server.
Frontend
Backend
Database
Testing & Tools
Data Source
Generated operational events
Backend Server
Express and Socket.IO
WebSocket
Live event delivery
Dashboard
React and Recharts
Incoming WebSocket events needed to update charts and KPI cards without creating unnecessary rendering problems.
- Integrating Socket.IO with React applications
- Updating charts from continuous event streams
- Building responsive data visualization dashboards
- Handling WebSocket connection lifecycle states
- Collaborating across frontend and backend responsibilities
- Designing reusable KPI and chart components
- Testing Node.js API endpoints
- Presenting real-time data without overwhelming users
Explore the system
See how live data becomes a usable interface
Review the source code, open the deployed dashboard or explore my other full-stack projects.